

( 숏 포지션으로 하락을 예측하다)
번역은 이상하지만 대략 숏포지션 예상가는 어느정도 이해가 가실듯합니다 제일 분석을 잘하는 트레이더라 그냥 참고용으로만 보시길 바랍니다 ( 대략 현재 국내거래소 기준 57000선 부근에서의 하락 숏포지션을 예상하고 있습니다)
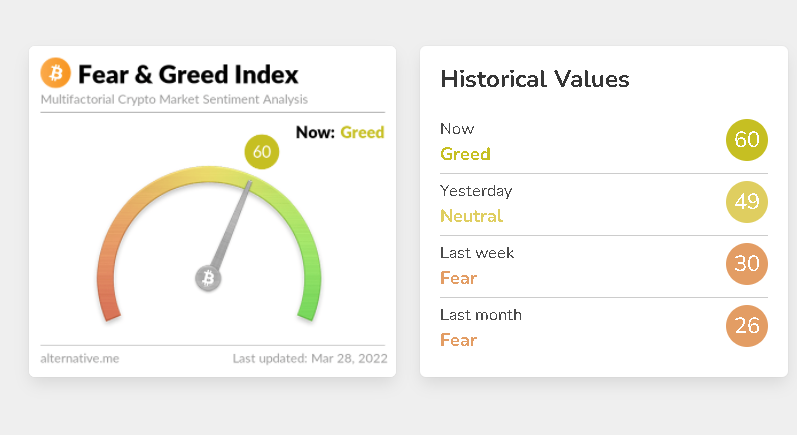
해외 얼터네이티브 크립토 공포지수는 60으로 탐욕상태이며 해외 points on the scale greed index 인덱스지수는 51로 현재 마찬가지로 탐욕 상태에 가까워지고 있습니다 현재 두나무 크립토지수는 65.92탐욕상태입니다
Daily Report – Bitcoin and Market Update (March 27 2022)
HTF 12H:

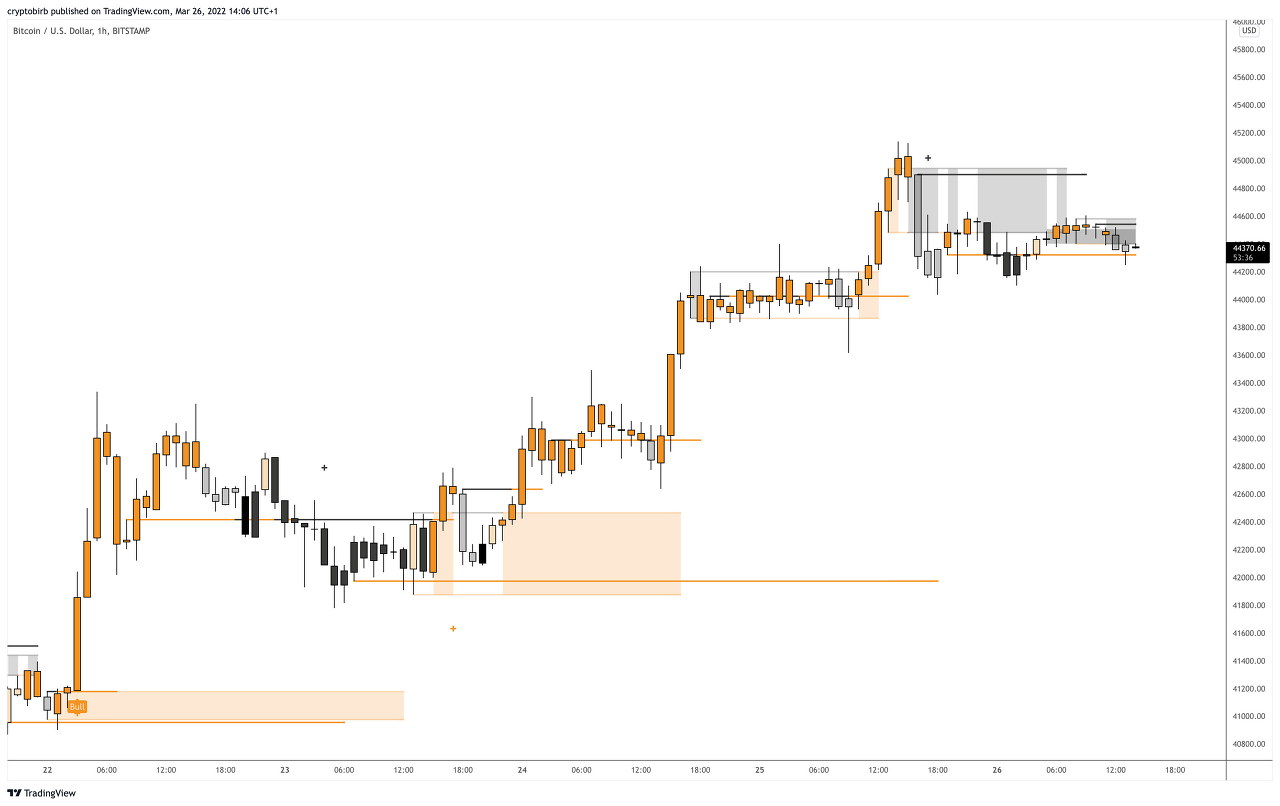
The middaily chart shows relatively clean picture of the most relevant levels marked up.
The price action analysis of bitcoin reveals the only resistance cluster that matters in the near-term for the pattern unfolding. Namely, it is 44500-45500 USD region that’s clustering a lot of supply side of the market, that’s been stopping bitcoin from an upwards breakout for the last several months. As long as this supply zone is unbreached effectively, BTCUSD would be forced to remain in the same pattern it’s been staying inside of which for months.
A breakout of the coil pattern measured between 33000 USD and 46000 USD seems to be due for a release. An upwards breakout would result in a measured move to the upside towards the target of 55000 USD region. For that, bitcoin needs a proper breakout retest over the 45500 USD resistance. Otherwise, the downwards potential is not out of cards just yet.
The BPRO indicates that the bulls maintain control over the market as long as BTCUSD does not close a day or a week below the CTF Trailer Stop at $42329. A clean break below that level may imply underlying and short-term weakness, and chances for the mid $30000s retest.
비트코인의 가격 행동 분석은 패턴 전개에 단기적으로 중요한 유일한 저항 클러스터를 보여줍니다. 즉, 시장의 많은 공급 측면을 클러스터링하고 있는 44500-45500 USD 지역으로, 지난 몇 달 동안 비트코인이 상승세를 타고 있는 것을 막고 있습니다. 이 공급 구역이 효과적으로 침해되지 않는 한 BTCUSD는 몇 달 동안 그 안에 머물렀던 동일한 패턴을 유지해야 합니다.
33000 USD와 46000 USD 사이에서 측정된 코일 패턴의 돌파는 출시 예정인 것 같습니다. 상향 돌파는 55000 USD 지역의 목표를 향해 상향으로 측정된 이동을 초래할 것입니다. 이를 위해 비트코인은 45500 USD 저항에 대한 적절한 돌파 재테스트가 필요합니다. 그렇지 않으면 하향 가능성이 아직 카드에서 나오지 않았습니다.
BPRO는 BTCUSD가 CTF Trailer Stop $42329 아래에서 하루 또는 일주일에 마감하지 않는 한 황소가 시장을 통제할 수 있음을 나타냅니다. 이 수준 아래로 완전히 무너지면 근본적인 단기 약세와 $30000 중반 중반의 재시험 가능성을 의미할 수 있습니다.
MTF 4H:

The MTF chart shows a little bit of a resistance at current levels around the mid 44000 USD field.
The BWAP block defines a price & volume backed region of 44300-44600 USD to be the main short-term resistance to overcome by the bulls. If that succeeds, bitcoin could unlock 46000 USD retest opportunity.
The Momentum Bands of BPRO imply that the most relevant short-term volatility range finds bitcoin trade between $41500 and $46000. A strong breakout outside either of these bands could imply in a more powerful and spectacular thrust towards either 50000 USD or mid $30000s, the way I see it.
An ascending trend line is also of some reference to the traders, locally. It provides to BTCUSD a dynamic support line, now placing a point at around 43000 USD, which if broken may accelerate a selloff into the 41500 USD region.
Meanwhile, BPRO Level Lines show supports at:
43147
42056
40338
36900
35474
These levels could be anticipated to serve as level-to-level references. In other words, when one level is breached, the next one in the direction of the movement
MTF 차트는 44000 USD 필드 중반 부근의 현재 수준에서 약간의 저항을 보여줍니다.
BWAP 블록은 44300-44600 USD의 가격 및 볼륨 지지 영역을 황소가 극복해야 할 주요 단기 저항으로 정의합니다. 성공하면 비트코인은 46000 USD 재테스트 기회를 잠금 해제할 수 있습니다.
BPRO의 모멘텀 밴드는 가장 관련성이 높은 단기 변동성 범위에서 비트코인 거래가 $41500에서 $46000 사이임을 의미합니다.
이 두 밴드 중 하나를 벗어나는 강력한 돌파는 내가 보기에 50,000달러 또는 30,000달러 중반을 향한 더 강력하고 화려한 추력을 의미할 수 있습니다.
오름차순 추세선은 또한 현지 거래자들에 대한 일부 참조입니다. 그것은 BTCUSD에 동적 지원 라인을 제공하여 현재 약 43000 USD에 포인트를 두며, 깨지면 41500 USD 지역으로의 매도를 가속화할 수 있습니다.
한편, BPRO 레벨 라인은 다음에서 지원을 표시합니다.
43147
42056
40338
36900
LTF 1H:
The hourly chart shows the BPRO Wave Pivots, which visualize the most relevant support and resistance lines or zones.
Apparently, BTCUSD is compressed intraday inside a narrow range 44300-44600 USD. A strong close outside either of these boundaries can result in further escalation in the direction of the breakout.
Potential resistance could be read at around 45000 USD on the upside with the support reading at 42000 USD, should the market break down.
Typically, bitcoin takes it a bit slower on the weekends, so it would make sense to expect volatility burst coming up around the next week open.
시간별 차트는 가장 관련성이 높은 지지선 및 저항선 또는 영역을 시각화하는 BPRO Wave Pivots를 보여줍니다.
분명히 BTCUSD는 44300-44600 USD의 좁은 범위 내에서 일중 압축됩니다. 이러한 경계 중 하나의 외부에 강한 마감이 있으면 브레이크아웃 방향으로 더 확대될 수 있습니다.
시장이 무너지면 잠재적 저항은 약 45000 USD에서, 지지선은 42000 USD에서 읽을 수 있습니다.
일반적으로 비트코인은 주말에 약간 느려지므로 다음 주에 변동성이 폭발할 것으로 예상하는 것이 합리적입니다.
FEAR/GREED INDEX
At 51 points on the scale, the market seems to be way more neutral per its sentiment, when compared with the situation from a couple of days ago.
While this is not a definite confirmation, it may serve as a valuable insight in terms of the market expectations about the direction of bitcoin trends. This may reveal, that after bitcoin has managed to break strongly towards the resistance levels of 45-46k USD, the traders have started feeling a little bit less stressed with less of bearish feeling to it. This may indicate that in fact some of the bears have been converted into bulls while looking at the up-sloping bitcoin movements. This may be some arguable hint about the market building the momentum. I read that as a positive sign in favor of the bulls.
That being said, the readings are not in its extremes anymore, as the bitcoin market reads neutral to the traders sentiment. The way I see it, I would refer back to my favorite stance on the contrarian trading:
“The market is usually right in the middle of trends, and usually wrong at the extremes”.
This does give me impression that we are looking at “the middle of trends” part more than “the extremes” now. It would be risky to play against the trend, and against the direction.
Hence, it’s not necessarily a good buying opportunity anymore in terms of contrarian trading, yet it works in favors of those who had used their purchasing opportunities during extreme fear periods.
More insights given in my yesterday’s webinar. Catch up if missed. God bless
척도의 51포인트에서 시장은 며칠 전의 상황과 비교할 때 감정에 대해 훨씬 더 중립적인 것으로 보입니다.
이것이 확실한 확인은 아니지만 비트코인 추세의 방향에 대한 시장 기대치 측면에서 귀중한 통찰력 역할을 할 수 있습니다. 이것은 비트코인이 45-46,000 USD의 저항 수준을 향해 강하게 돌파한 후 거래자들이 약세 느낌을 덜 받고 스트레스를 조금 덜 받기 시작했음을 드러낼 수 있습니다. 이것은 실제로 비트 코인 상승 추세를 보면서 일부 곰이 황소로 전환되었음을 나타낼 수 있습니다. 이것은 시장이 모멘텀을 구축하고 있다는 논쟁의 여지가 있는 힌트일 수 있습니다.
나는 그것을 황소에 찬성하는 긍정적인 신호로 읽었습니다.
즉, 비트코인 시장이 거래자의 감정에 중립적으로 읽히기 때문에 판독값이 더 이상 극단에 있지 않습니다. 내가 보기에는 역발상 거래에 대해 내가 가장 좋아하는 입장을 다시 언급하겠습니다
'오늘자 세계 코인 현황지수 > 세계 트레이더 분석예측' 카테고리의 다른 글
| 2022 04 25 전세계 트레이더 비트코인 현재 흐름분석 (0) | 2022.04.25 |
|---|---|
| 2022 4월 전세계 트레이더들 비트코인분석 (0) | 2022.04.15 |
| 2022년 비트코인 세계 트레이더 분석 (0) | 2022.04.08 |
| 전세계 비트코인 흐름분석 (0) | 2022.03.31 |
| 2022년 유명 해외 트레이더 분석 (0) | 2022.03.29 |


