

- crypto brib -
The middaily chart has canceled the prior “bullish” indication mid day, right along with bearish selloff on equities following the FED’s J Powell commentary over tighter monetary policy plans ahead.The CTF Trailer remains the main breakout level to validate any upwards thesis at $42405. So far, it has failed to be reclaimed by the bulls, and the bearish advantage continues, while bitcoin consolidates inside a narrow range of prices $38500 through $43000.The bears have maintained the control over the market in the near-term, at least.The BWAP block implies resistance region at 40.2-40.6k USD region. As long as bitcoin fails to reclaim it, the bears have the upper hand in the market, aiming for potential price targets into the mid 30000s USD levels.
현재의 시장은 연준 긴축 발표로 인한 단기적 하락 추세로 변환되었습니다 현재 비트코인의 약세 지점 기준 비트코인 시세 38500~43000달러 기준 이가격 범위내에서 횡보 가능성을 높게 평가하고 있습니다 현재 추세에서의 약세 저항 통제력은 어느정도 유지되고 있습니다 현재 bwap 블록 영역 40.2~40.6k USD영역에서의 현재 약세 저항부분을 두고 트레이딩 중으로 현재 이 추세로 기준으로 30000만달러 중반 USD을 기준으로 잡고 목표로 트레이딩 중입니다
(현재 추세는 공매도로 트레이딩하고 있으며 현재 35000달러까지 하락을 예측하고 있다 원화기준 국내거래소 비트코인시네는 43,000,000KRW 까지 내다보고 있다 ) 포지션 - 숏포지션 위치
-MMBT TRADER-
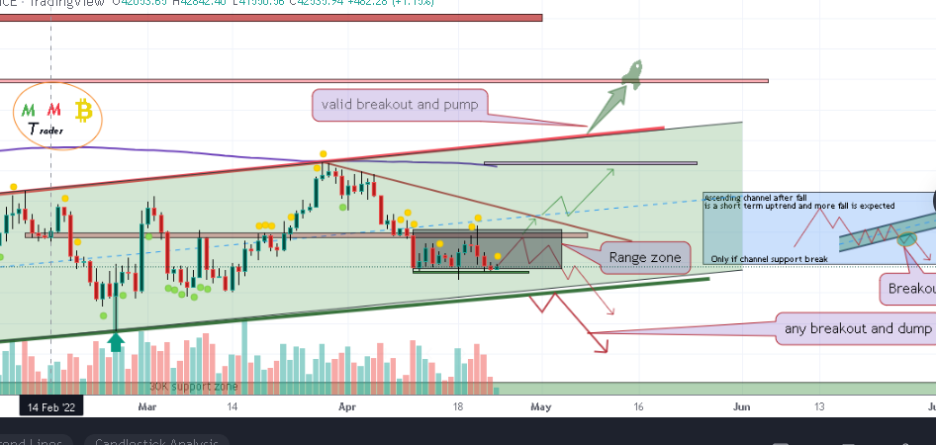
now is the local range zone for price and after any breakout on this range zone with the high volume , we can expect a new path. If range zone support(39K$) remains valid then more range is expected.Also only if the 42K resistance zone breaks we can expect bullish market to lead again.
현재 39000만달러 부근에서의 기준점의 무너진다면 새로운 강세 포인트을 받을수 있을것이라고 예측하고 있다 현재 39000만달러 48,800,000KRW부근에서 새로운 상승 추세로 변환될 가능성이 미약하게나마 존재한다 39000달러까지 홀딩중 39K 선이 무너지면 공매도로 전환 / 39K선 돌파후 바로 롱포지션으로 스위칭 가능성이 높아보인다)
(39K = 38.800.000KRW 기준 하락시 공매도로 전환 상승시 롱포지션 스위칭)
-SKYLEX-
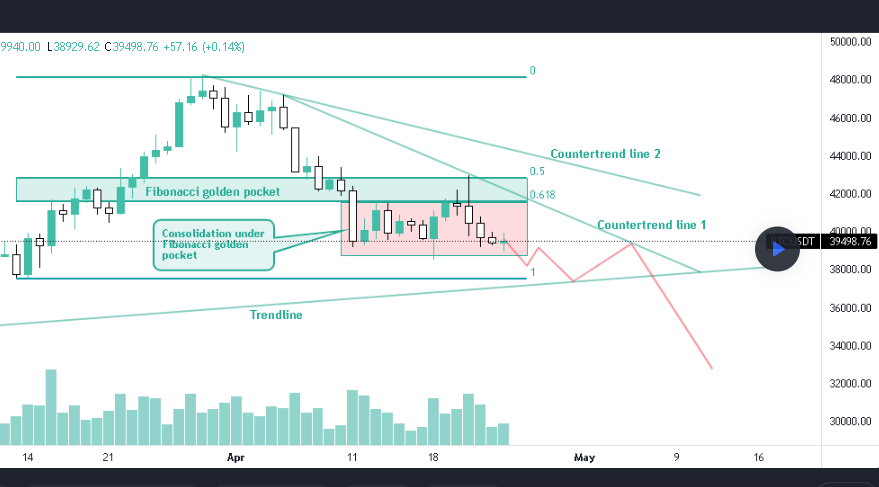
Yesterday I showed you very interesting scenario using Wyckoff methodology. I supposed that the Bitcoin is in large distribution phase and now the price is going probably to enter into markdown phase. Let’s take a look at classical tools to try to anticipate what is coming next. On the 1D chart I drew the Fibonacci retracement for the last upside impulse. Until the BTC price is above the 1 Fibonacci level it is technically still in correction, not in the downtrend. But, we can see that the price easily broke down the Fibonacci golden pocket and formed the consolidation. It is the extremely bearish signal, which coincides with the sign of weakness from the Wyckoff approach.I suppose now the drop to the trendline, some bounce to the countertrend line 1 and the dump below $33k.
현재 비트코인은 대규모 유통단계에 위치해 있으며 아마 단기적인 하락보단 지속적인 하락 추세로 변환될듯 보인다 1D차트에서의 마지막 상승 충동에 대한 피보나치 되돌림을 분석하였다 현재 BTC 1피보나치 수준보다 높을때을 가정한다면 여전히 시장은 현재 조정장으로 분석하고 있다 이는 급격한 하락추세로 보기 힘들다 현재 가격이 쉽게 피보나치골든 부분을 붕괴한다고 가정된다면 33000만달러 부근까지 하락을 보고 있다
(현재 33000만달러 41.000.000KRW까지 하락 추세을 예측중으로 분석된다 - 현재 포지션은 숏포지션으로 분석된다)
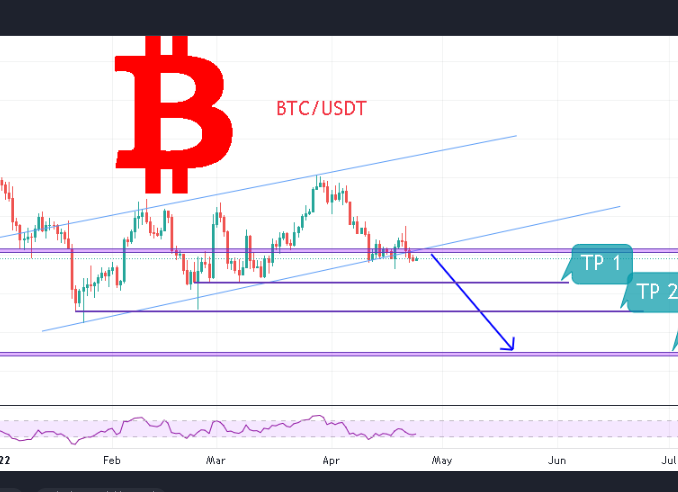
Based on the chart and our previous analysis we had an uptrend expectancy but as our uptrend channel broke, we can consider this bullish movement just as a correction in the market.So it would be highly possible to see a drop in price for the following days on
현재 우리는 약간의 상승 추세을 기대했지만 시장은 현재 조정장에 가깝게 흘러가고 있으며 현재 하락세에 집중하고 있다
( - 현재 포지션은 숏포지션으로 예측된다_)
장기 보유자 / 단기 보유자
롱숏 포지션 홀딩비율/
1).진입가 평균 38.800만달러 / 평균 이탈률 -3.2% 숏롱 포지션 청산비율 70(숏):30(롱)
2).선물 레버리지율-0.3%급감 / 단기보유자률 +2.1% 상승 / 장기보유자률 이탈-1.2% 하락
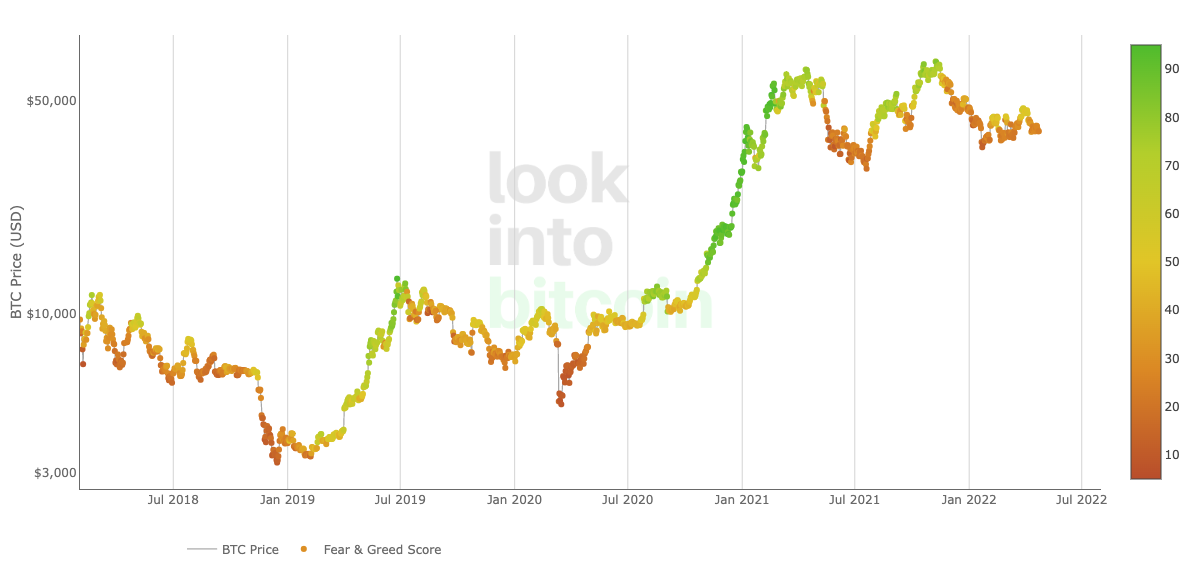
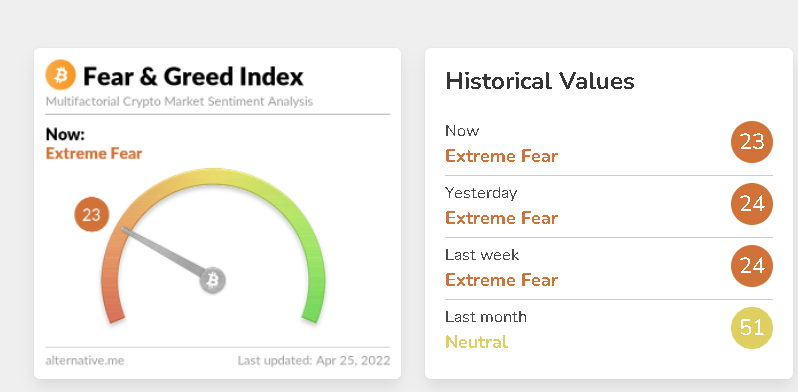
3).크립토 공포지수 얼터네이티브 기준 - 23점 / (극도의 공포상태) 매도세 증가폭 전체 +2.3% 상승
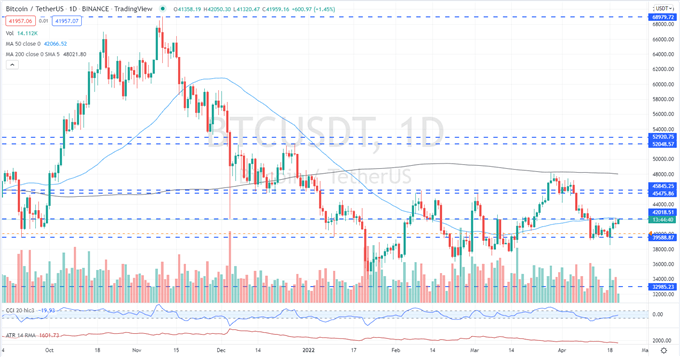
Bitcoin (BTC/USD) Latest –
$42k Resistance Coming Under Renewed Pressure
-가상화폐 현재 해외 뉴스 분석 -2022 04 25일 기준 19:00
Bitcoin is making a comeback after the heavy selling seen earlier in the month and is now pressing against an old resistance level and an important technical indicator that guard a further move higher in BTC/USD. While risk markets remain nervous, any move higher in Bitcoin will be limited at best, but the technical setup for BTC/USD is now looking more positive.The largest cryptocurrency by market capitalization is currently testing $42k again after breaking and then retreating below this level yesterday. The late March/early April sell-off in the pair now looks to be over after a support zone around $39.6k held firm and prompted a move higher. The mid-April low produced a multi-month low reading on the CCI indicator highlighting the oversold nature of Bitcoin, and this reading is now moving higher as the sell-off is washed out.
추가 상승을 보호하는 오래된 저항 수준과 중요한 기술 지표를 압박하고 있습니다. 위험 시장은 여전히 불안하지만 Bitcoin의 더 높은 움직임은 기껏해야 제한적이지만 BTC/USD에 대한 기술 설정은 이제 더 긍정적으로 보입니다.시가 총액 기준으로 가장 큰 암호화폐는 어제 깨고 이 수준 아래로 후퇴한 후 현재 다시 42,000달러를 테스트하고 있습니다. 3월 말/4월 초 쌍의 매도세가 $39.6k 주변의 지지대를 견고하게 유지하고 더 높은 움직임을 촉발한 후 이제 끝난 것으로 보입니다. 4월 중순 저점은 비트코인의 과매도 특성을 강조하는 CCI 지표에서 여러 달 동안 낮은 수치를 기록했으며, 이 수치는 현재 매도세가 사라지면서 더 높게 움직이고 있습니다.
( 현재 장은 40000달러 부근 48,000,000krw 돌파시 상승 추세 변환 가능성이 높게 보고 있다 현재 42000달러에 대한 테스트 중으로 평가되며 현재 39.6k부근이 지지선 부근이 횡보한다면 한차례 더 상승할 가능성에 초점을 두고 있다)
'오늘자 세계 코인 현황지수 > 세계 트레이더 분석예측' 카테고리의 다른 글
| 비트코인 이더리움시세 현재 분석 (Bitcoin, Ethereum) (1) | 2022.06.17 |
|---|---|
| 루나코인 ceo 권도형 비트코인 보유 공개 거부권 행사중? (0) | 2022.05.16 |
| 2022 4월 전세계 트레이더들 비트코인분석 (0) | 2022.04.15 |
| 2022년 비트코인 세계 트레이더 분석 (0) | 2022.04.08 |
| 전세계 비트코인 흐름분석 (0) | 2022.03.31 |


